LiloTrace
Ready to integrate tracers to your web ordering module?

Tracer integration for your online shops?
We have made it easy to integrate your online glass order with tracer support.
We have created a small program that connects to your tracer and outputs your trace in an easy-to-read format.
There is support for Windows, Mac, and Linux.
It’s easy to get started, take a look at our online demo, the source code is freely available so you can brand it completely as you wish.
We would really rather show how easy it is instead of writing a lot of explanations.
Try our demo
We have made a demo page you can try here, just go to our web client on the button below and select “Get demo OMA”. It is exactly the same way you retrieve a trace when our LiloTrace program is installed on your computer.
All-inclusive
This is what you get in the package:
- Save all traces to the output folder
JSON output from your tracer - Public link to your OMA file
- HBOX and VBOX measures
- Diameter measures
- SVG image of the glass
- Retrieve previous traces
- Tag your traces for later use
Get started in 5 steps
It’s super easy to get started, and let all your customers send trace data to you.
1. Download Lilo-Trace
All you have to do is click the button below and download our software.
Browsers today are not happy about .exe files, so some browsers might come up with the “The software might be dangerous“.
And then install the newly-downloaded file.
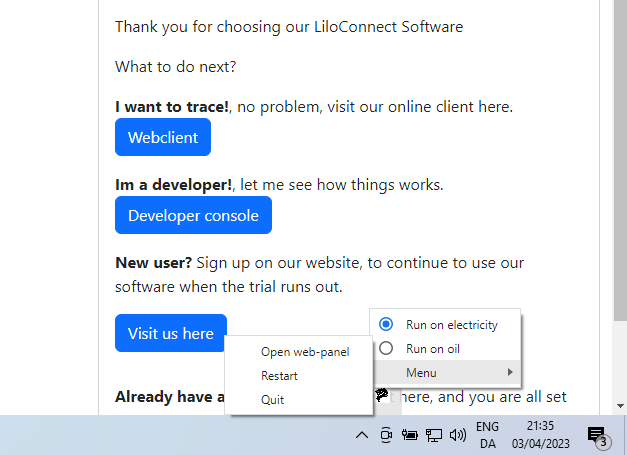
Verify its installed by the icons in your task menu which appear when Lilo-Trace is running.
Also, when you are running the trial version a browser containing your web panel will start up automated, this is used to register your license.
2. Open WebClient
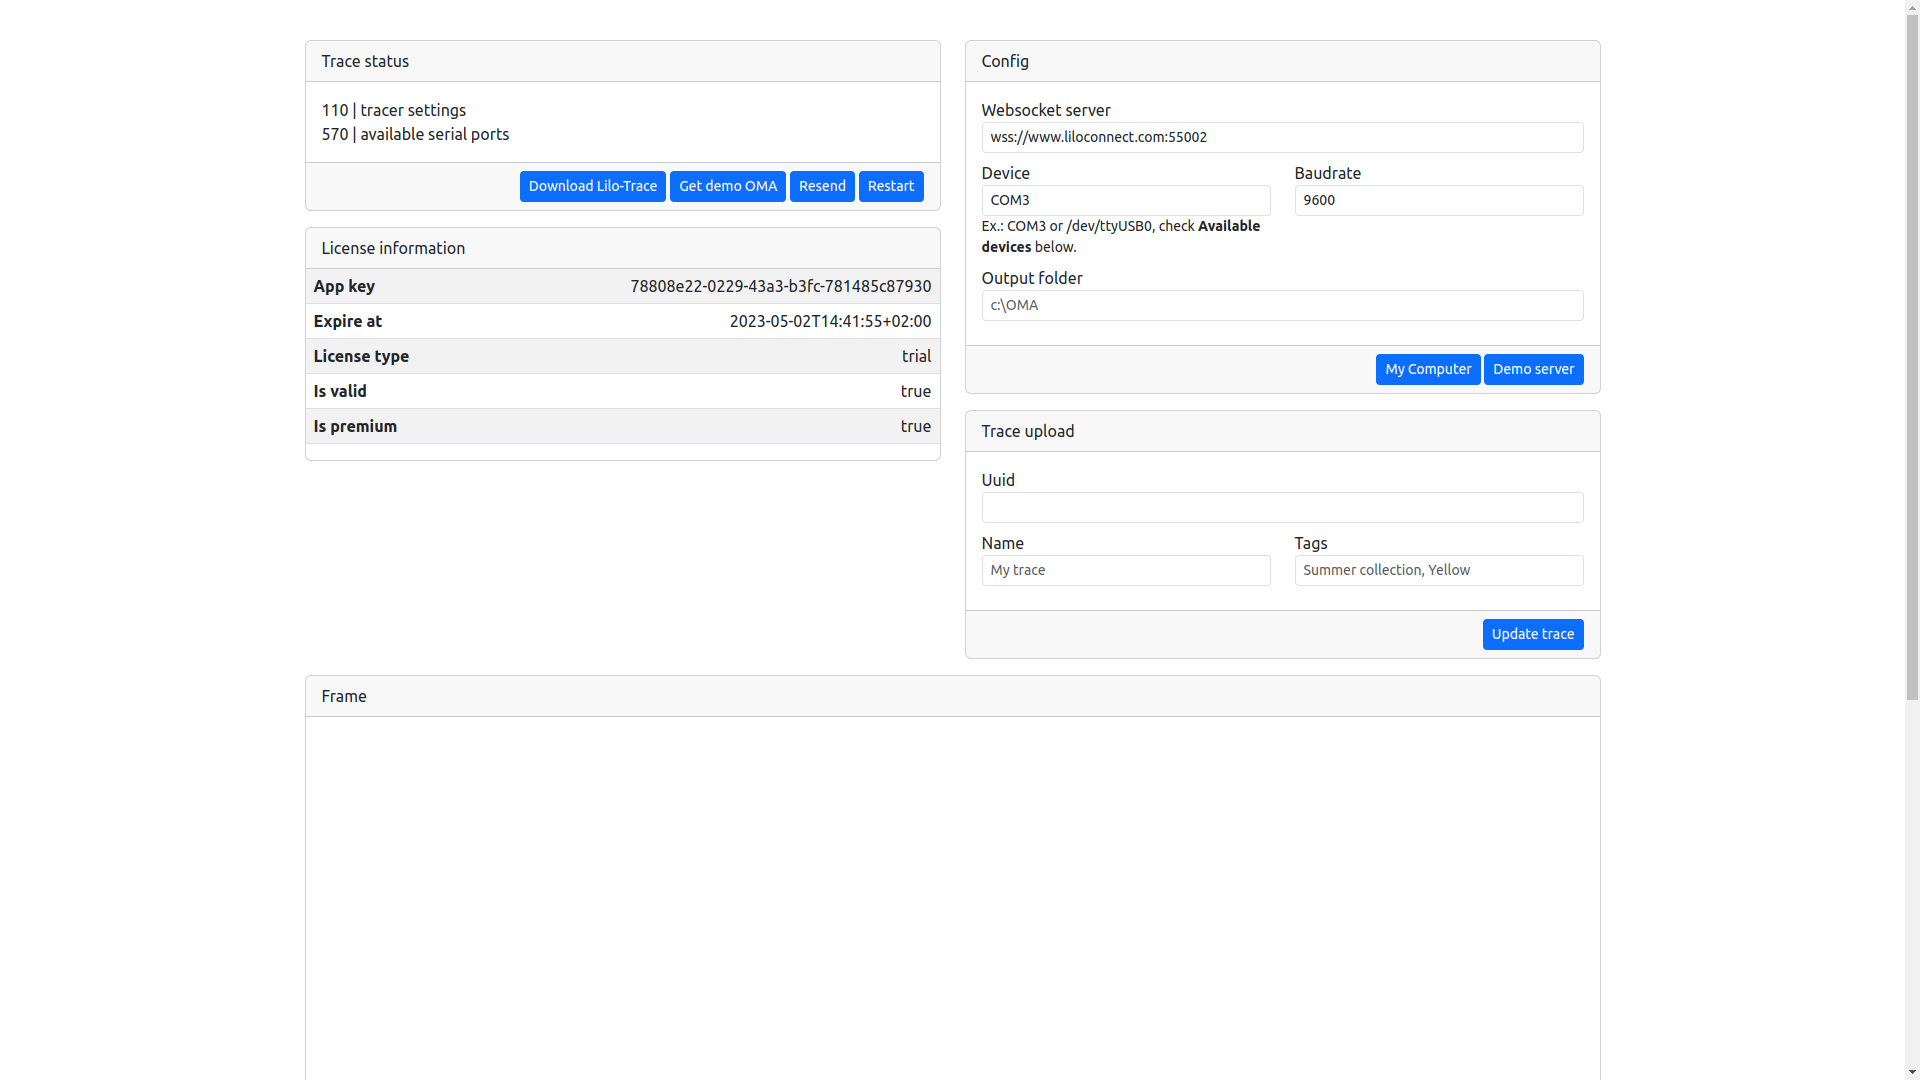
When installed, simple enter our Webclient to get started tracing right away.
Feel free to copy the webclient, and brand it however you like for your business.
3. Set port and baud rate
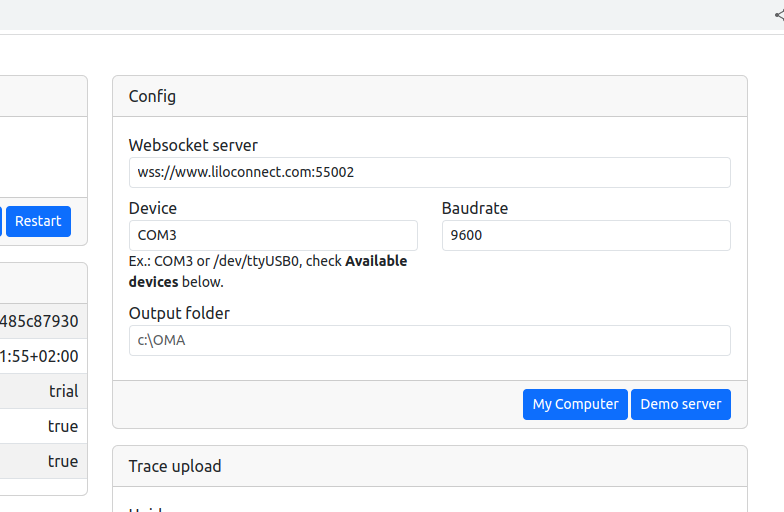
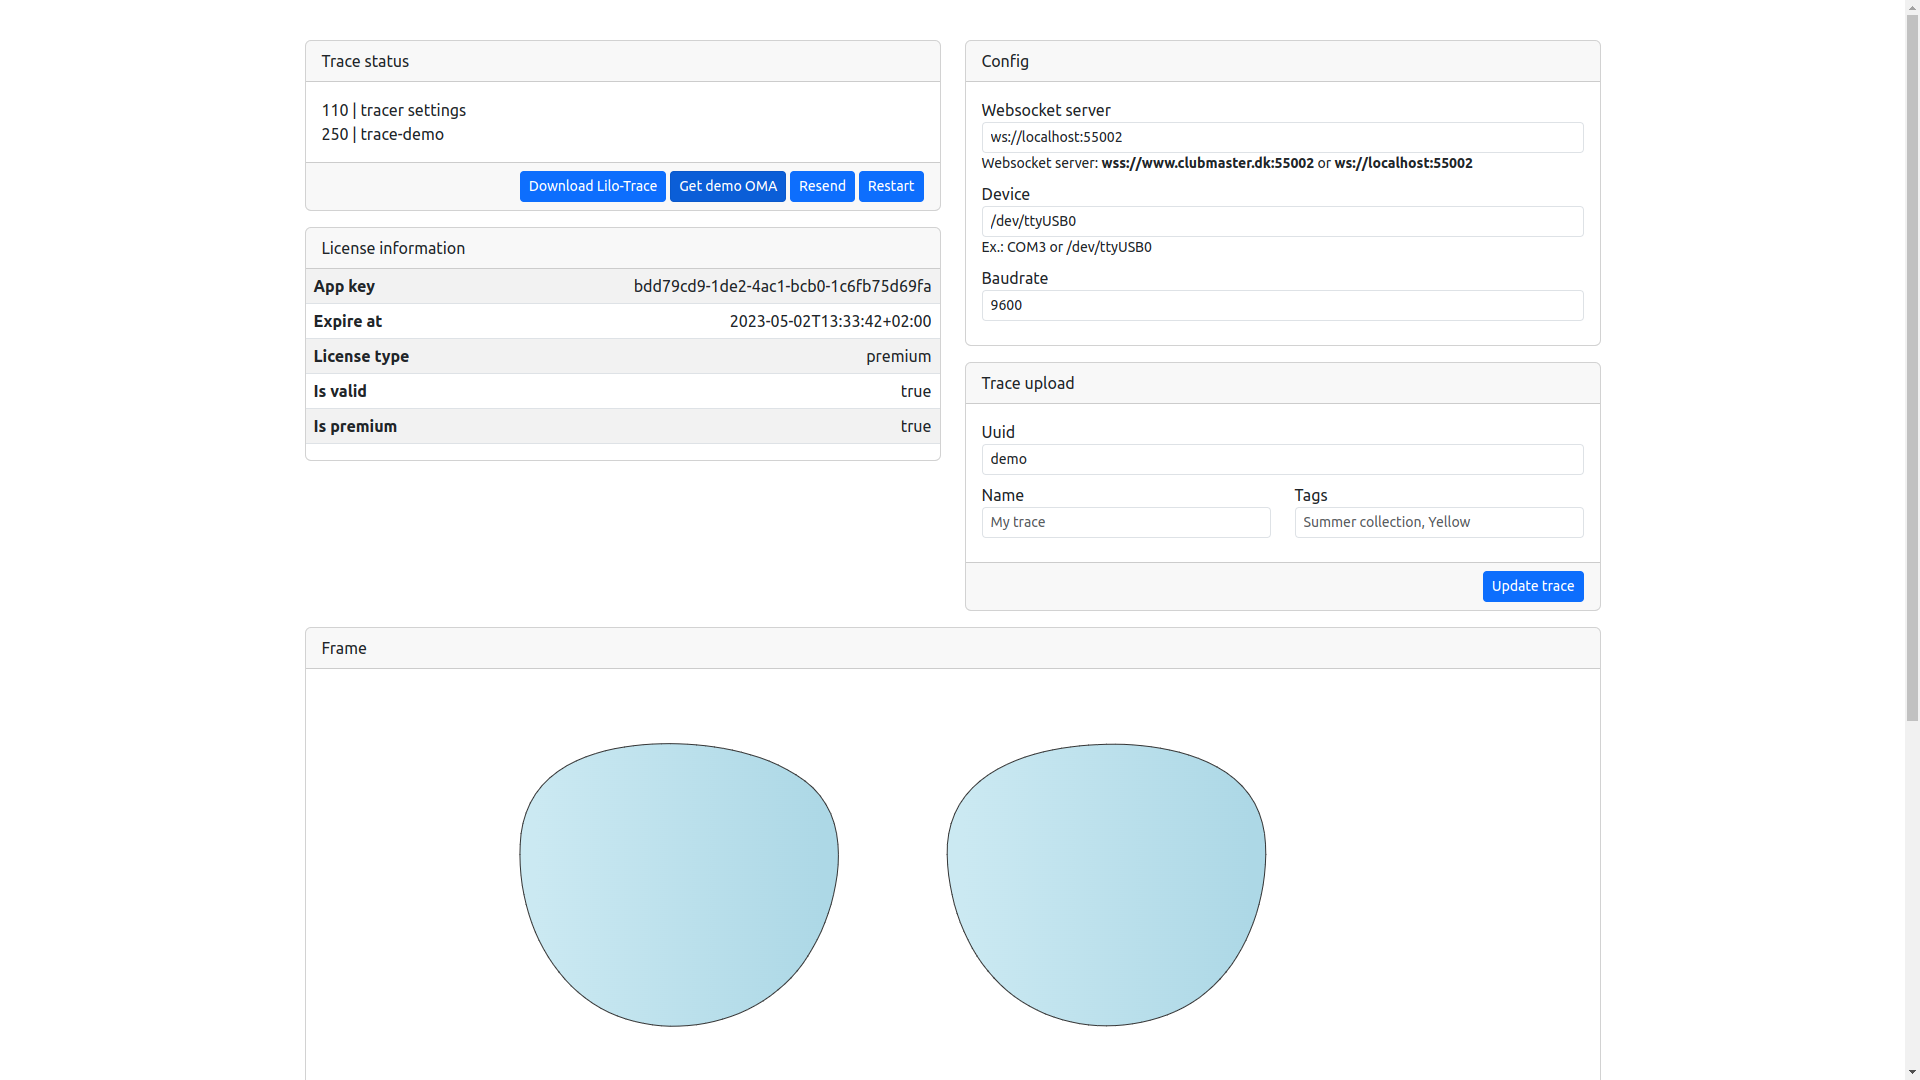
Not much to configure, simply make sure your tracer is set to OMA protocol, and then all you have to do is set the right baud rate.
Also if you want to store the trace on your computer, you can set an output folder for that, and all traces will be saved locally.
4. Trace
Now, push the Data button on your tracer, and watch the trace appear automated on your screen, and in your output folder if set up.
If you set up the output folder, you don’t even need to have the client running, it will just appear in your output folder.
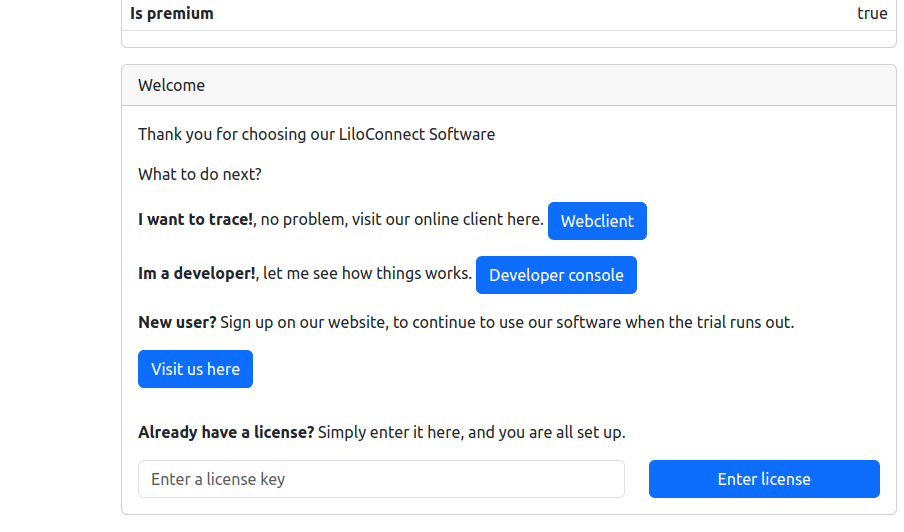
5. Register your license
Go to your cloud panel where you can also find all your previous traces, https://my.liloconnect.com.
Register either a small or premium license of your choice.
Copy that to your web panel from the first step. You can access it on the computer with Lilo-Trace at http://localhost:55001.
Our pricing
You will always get a 1-month free trial to see if this is something for you.
Small
- 1 PC license
- Connect to any OMA tracer (RS232, USB)
- Get OMA format
Premium
- 1 PC license
- Connect to any OMA tracer (RS232, USB)
- OMA format
- Shareable link to OMA file
- JSON with HBOX, VBOX, diameter and much more
- SVG image of the lenses
- Upload to cloud solution
- Shareable trace gallery
Bigger quantities?
Need more?- Need bulk licenses for your web shop, contact us for an offer.
- Need a branded version, contact us for information.
We will send you a payment link a day after you have made a license registration on our my.liloconnect.com portal.
On all our products you can choose to pay monthly, or pay yearly and get a 20% discount.
For developers
If you are a developer, please read along here.
The source code for our client is free to use, you can take it and put your own branding on it, or use it completely as you wish.
Communication between the desktop program LiloTrace and the web client works using websockets.
When you download your trace from the tracer, the web client automatically downloads data, and you can process it as you wish.
When you look at the web client, have your website inspector ready (Chrome F12), here you can follow all communication in the console log.
Please also look at the bottom of the web client, here you can see 3 text boxes.
1. OMA file after trace
2. JSON object for processed data
3. All available ports on the computer for faster setup
If you have questions or input, you can always get hold of us, and we will help you further.
Chrome console for the rescue
.. And remember to check the chrome console for any debugging, it’s really the fastest way to understand how the server is working 🙂
